

Elasticsearch for APM
Lets discover Elasticsearch for APM works
Have you ever wondered how to simply monitor your application’s performance? Elastic APM is the solution. Elastic Application Performance Management (APM) is a new Elasticsearch 6.1 functionality (in beta and alpha in 6.0). Opbeat (an application performance monitoring – APM – firm) merged with Elastic a few months ago to establish Elastic APM.
Adding APM (Application Performance Monitoring) to the Elastic Stack is an obvious next step in offering consumers end-to-end monitoring, from logs to server-level metrics, application-level metrics, and the end-user experience in the browser or client.
In this post, we’ll look at how to monitor the performance of a Python Flask application using Elasticsearch’s APM functionality, as well as how to get informed (by webhook or email) when anything happens in your application.
What is APM?
If you were asking about APM and what are its purpose, take a quick look on: APM – Application Performance Monitoring
What is ELK Stack?
ELK is an abbreviation for a suite of three prominent projects: Elasticsearch, Logstash, and Kibana. The ELK, also known as Elasticsearch, allows you to collect logs from all of your systems and applications, analyze them, and build visualizations for application and infrastructure monitoring, speedier troubleshooting, security analytics, and other purposes.
Elaticseach
Elasticsearch is a distributed search and data system built on Apache Lucene. Elasticsearch is an excellent solution for a variety of use cases in log analytics and research due to its support for numerous languages, great performance, and JSON documents without schema.
Logstash
Logstash is an open source data ingestion software that allows you to take data from several sources, alter it, and deliver it to the destination of your choice.
Kibana
Kibana is a free, open-source Elasticsearch and Logstash analysis and visualization layer. Kibana allows users to explore aggregated log information stored in Elasticsearch indices. It also simplifies the search, analysis, and visualization of huge volumes of data, as well as the detection of trends and patterns.
Elastic APM, as the name indicates, is an application performance monitoring solution built on top of the ELK Stack (Elasticsearch, Logstash, Kibana, Beats). Elastic APM, like other APM systems you may have heard of, allows you to track crucial performance-related information such as requests, answers, database transactions, failures, and so on.
Elastic APM is comprised of four core open source building blocks: Elasticsearch for data storage and indexing, Kibana for data analysis and visualization (the APM page in Kibana is included with an X-Pack basic license), and two APM-specific components: the APM server and the APM agent.
APM agents are in charge of gathering performance data and transmitting it to the APM server. In our apps, the various agents are instrumented as a library. The APM server is in charge of receiving data, producing documents from it, and storing the data in Elasticsearch.
In this article, you’ll see how to configure Elastic APM for a simple node. On AWS, a single Ubuntu 16.04 computer runs a js app.
Installing the APM Server
As previously stated, the APM server gathers and passes the performance data collected by the agents to Elasticsearch.
We will use the following commands to install the APM server using apt:
apt-get install apm-server sudo
To start the server, do the following:
sudo service apm-server startTo ensure that the brand new apm-server index is generated, we may use Elasticsearch:
health status index                           uuid                   pri rep docs.count docs.deleted store.size pri.store.size
green  open   .kibana                         7CdGpSpuTDqSpzDGfV5XmQ   1   0         17            1     58.8kb         58.8kb
yellow open   apm-6.4.3-onboarding-2018.11.12 4XSxUrWnQryD9yRCwPmCRQ   1   1          1            0      5.9kb
Installing the APM agent
1st we’ll start by:
npm install elastic-apm-node --saveFollowing that, you will construct the app’s primary file.
sudo vim index.jsBefore requiring any further modules, you must first run the APM agent.
Put the following code at the very start of our new file:
var apm = require('elastic-apm-node').start({
  serviceName: 'demoapp',
  serverUrl: 'http://localhost:8200'
})
then copy and paste some ‘hello world’ express code:
const express = require('express')
const app = express()
app.get('/', (req, res) => {
 res.send('HEY!')
})
app.listen(3000, () => console.log('Server running on port 3000'))
To begin the server:
node index.jsAnalyzing in Kibana
You may investigate this data in Kibana in the same way you would any other data—by querying and visualizing it. Another alternative is the APM page, which is discussed below but is only available with the X-Pack basic license.
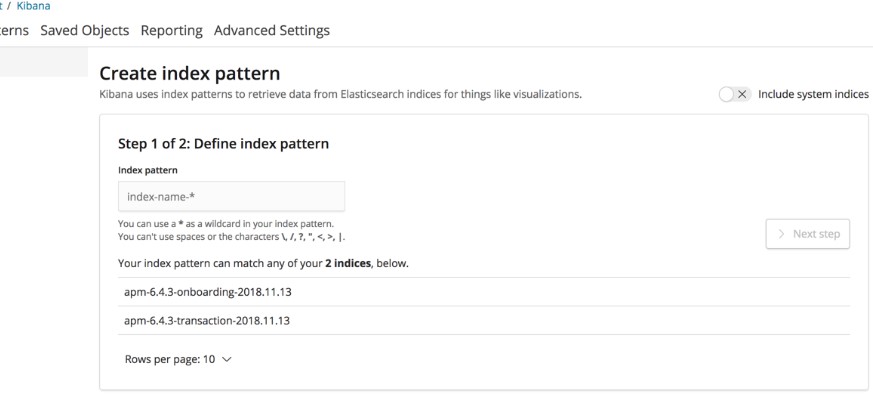
But first and foremost, we must define the new index in Kibana. When we query Elasticsearch for indices, we find that two apm-* indices have been created:
curl -XGET 'localhost:9200/_cat/indices?v&pretty'

health status index                            uuid                   pri rep docs.count docs.deleted store.size pri.store.size
yellow open   apm-6.4.3-transaction-2018.11.13 ikIjni6qSDmgix2K9zC8vQ   1   1          5            0       37kb           37kb
yellow open   apm-6.4.3-onboarding-2018.11.13  -boQQic_S2ePPPtJ3HP83w   1   1          1            0      5.9kb          5.9kb
green  open   .kibana                          m4IxzDFrT9CkiB8EqpD3Kw   1   0         17            1     49.3kb         49.3kb
In Kibana, these indices can be loaded in two ways. One method is to use the Index Patterns tab on Kibana’s Management page.
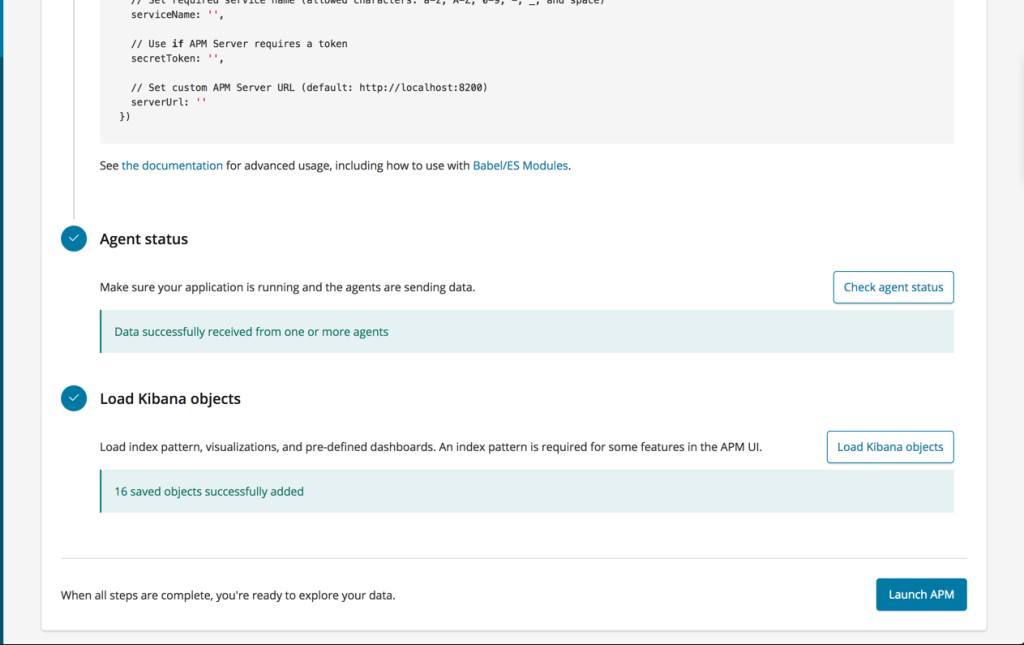
The other method is to use the APM website, where clicking on Setup Procedures provides a tutorial that details some of the aforementioned instructions. This option is useful for ensuring that the APM server and agent are functioning properly.
Load Kibana objects is available at the very bottom of the page. When you select this option, the index patterns, visualizations, and dashboards will be loaded.
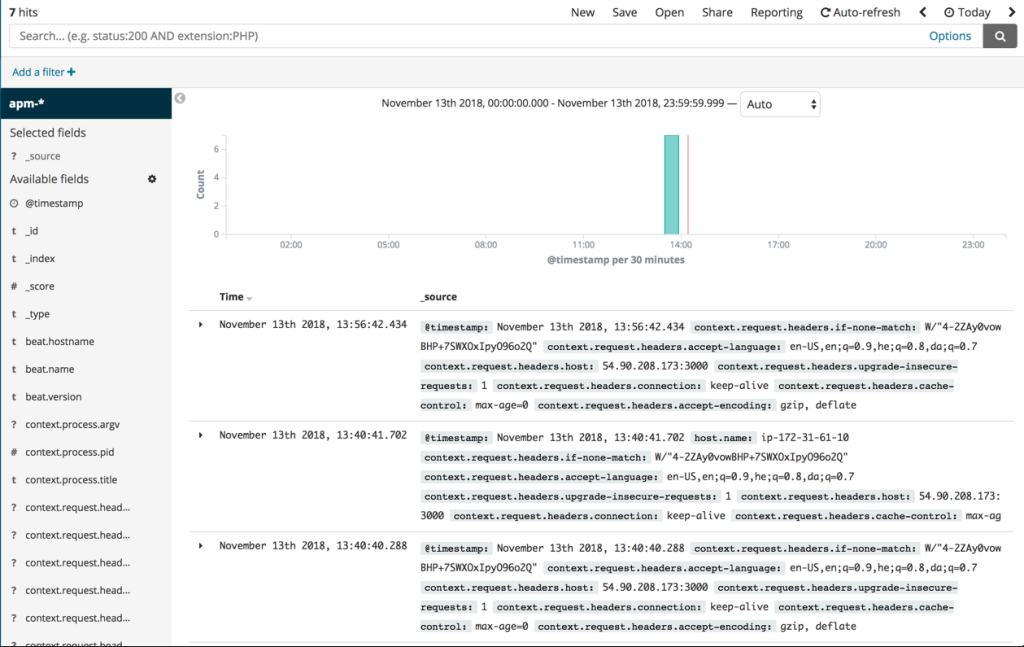
Once you’ve specified the index patterns, the discover tab will display your transaction data as well as any exceptions.
The ‘demoapp’ service defined in the index.js file is mentioned under Services on the APM page.
Clicking it brings up a dashboard with information on app requests (response times and requests per minute).
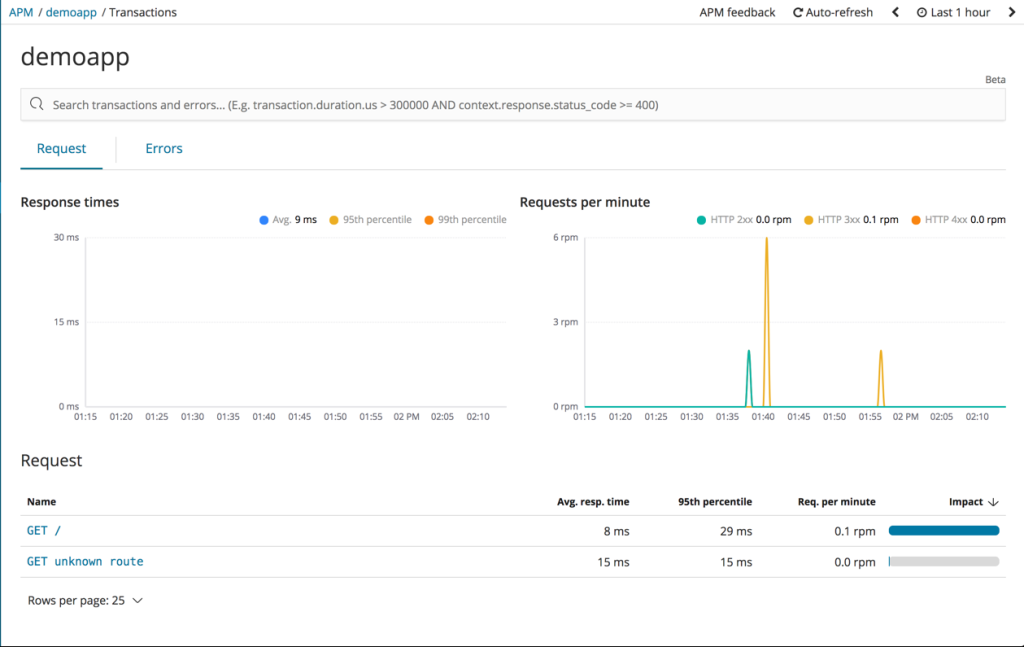
You may click on a request to gain more information about it, the answer, and information about the system or user. Again, this APM page is included with the standard X-Pac license. You may, however, create your own thorough dashboard in Kibana.