ELK Stack: A Tutorial to Install Elasticsearch, Logstach, and Kibana on Docker
The Elastic Stack, formerly known as ELK Stack, is always mentioned when it comes to log management and log management solutions. But what exactly is the Elastic Stack, and why do so many people favor it over many other log management platforms?
What is ELK Stack?
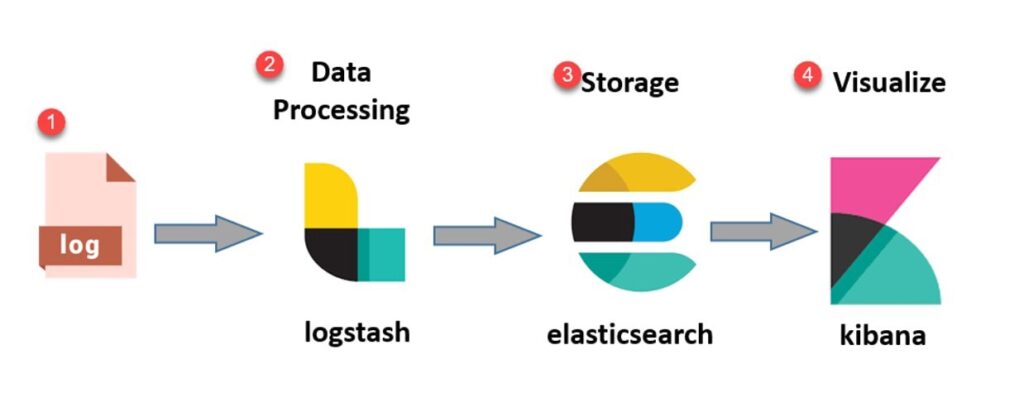
Elasticsearch, Logstash, and Kibana software tools that, when combined, form a comprehensive solution for gathering, organizing, and analyzing log data from on-premises or cloud-based IT settings.
Elasticsearch
The ELK or Elasticsearch stack is built on Elasticsearch, a prominent full-text search engine. It is a search, and analytics engine first launched in 2010 and built on the Apache Lucene library. DevOps teams can utilize Elasticsearch to index, query, and analyze log data from different sources within complicated IT systems.
Logstash
Logstash is a log aggregator and processor that operates by reading data from several sources and transferring it to one or more storage or stashing destinations. Logstash is a server-side data processing pipeline that can ingest logs from various data sources, parse and convert the log data, and then deliver it to an Elasticsearch cluster for indexing and analysis. Logstash comes with ready-to-use inputs, filters, codecs, and outputs to let you extract useful information from your logs.
Kibana
Kibana is an, Elasticsearch and Logstash analysis and visualization layer. Users can use Kibana to investigate aggregated log data stored in Elasticsearch indices. It also makes searching, analyzing, and visualizing massive amounts of data and detecting trends and patterns simple.
Why Should You Use ELK Stack for Log Analytics and Management?
The ELK Stack has grown in popularity as a business log management tool. The following are some of the reasons why so many DevOps teams use the ELK stack for logs:
Logs are critical -For software-dependent enterprises, log analytics gives crucial visibility into IT assets and infrastructure, addressing use cases such as cloud service monitoring, DevOps application troubleshooting, and security analytics. ELK gives these enterprises the tools to monitor increasingly complex IT infrastructures.
Opensearch on the other hand is a fully open-source alternative. That means they’re available for free download, and users can create plug-ins and extensions and modify the source code. It’s simple for enterprises to start using the ELK stack for log analytics because there is no software licensing costs.
Use Cases That Have Worked – Some of the world’s largest and most well-known IT organizations have employed the ELK stack for log management, Such as LinkedIn and Netflix
How to Install Elasticsearch, Logstash, And Kibana with docker
If you have decided to work with ELK and manage it yourself or play around with it, there are multiple ways to deploy it:
- First option is to install each of the ELK components individually on your host along with all their dependencies and requirements (nginx, jre etc), then configure all components to communicate with each other, this method offers more flexibility when it comes to configuring your software but can be very complicated to set up initially and may require intervention of experts to make sure your deployment is reliable and secure.
- Second option is Install each component separately but using docker images: this method is relatively easier than the first option but still requires a lot of configuration to match your business needs and to make your deployment reliable and secure.
- Third option is to use a pre-configured docker image that contains the three components (Elasticsearch, Logstach and Kibana), this one is very easy to deploy and requires almost no configuration, we recommend using this method for personal labs only and to get your hands dirty.
In a professional/production environment, the ELK stack will be deployed using either of the first two options, if you are looking to setup an ELK stack to manage your logs and monitor your environments ZEN NETWORKS experts can help you setup…
For the sake of making this tutorial relatively short and to get you going as fast as
possible we will be looking at the third option to deploy the ELK stack.
Prerequisites
Make sure Docker and Docker-compose are installed on your machine before you
continue. check the official documentation to install Docker on your corresponding operating system.
Elasticsearch uses a mmapfs directory by default to store its indices. The default operating system limits on mmap counts is likely to be too low, which may result in out of memory exceptions and the docker container not starting. On linux you will
have to increase the limits to at least 262144 by running the following command as root:
sudo sysctl -w vm.max_map_count=262144A minimum of 4GB RAM, Elasticsearch alone needs at least 2GB of RAM to run.
Installation
First step is to pull the docker image that we will be using locally, to do that run the
following command:
sudo docker pull sebp/elkThe previous command will pull the latest version available of the image, if you need to pull specific version combinations of Elasticsearch, Logstach or Kibana, you can do so using tags.
For example, the image containing Elasticsearch 1.7.3, Logstash 1.5.5, and Kibana 4.1.2 (the last image using the Elasticsearch 1.x and Logstash 1.x branches) is tagged E1L1K4, so you can use
sudo docker pull to pull sebp /Elk:E1L1K4You can find a list of all available tags on Docker Hub’s sebp/elk image page
Usage
To run the docker image we have just pulled we can use either plain Docker or using Docker-compose for more customization.
Using Docker
Simply run the following command:
sudo docker run -p 5601:5601 -p 9200:9200 -p 5044:5044 -it --name elk
sebp/el
The whole ELK stack will be started and accessible using the published ports:
- 5601 (Kibana web interface).
- 9200 (Elasticsearch JSON interface).
- 5044 (Logstash Beats interface, receives logs from Beats such as Filebeat).
To access the Kibana web interface use the URL:
http://<ip-of-your-host>:560We aim to inform you that Zen Networks provides services around log monitoring automation and DevOps.
Zen Networks is a leading provider of advanced IT solutions, specializing in log monitoring automation and DevOps. Our expert team offers a wide range of services, including IT monitoring, cloud services, agile solutions, and automation. We are also well-versed in the installation and implementation of Elasticsearch, Logstask, and Kibana on Docker.
By leveraging our extensive domain expertise and innovative technologies, we empower our clients to optimize their IT infrastructure and achieve operational excellence. Our solutions are designed to help organizations of all sizes to streamline their processes, improve efficiency, and reduce costs.
We invite you to take advantage of our complimentary consultation and quote service to learn more about how we can help your organization to achieve its IT goals. Contact us now to schedule your consultation and discover the benefits of working with Zen Networks.