
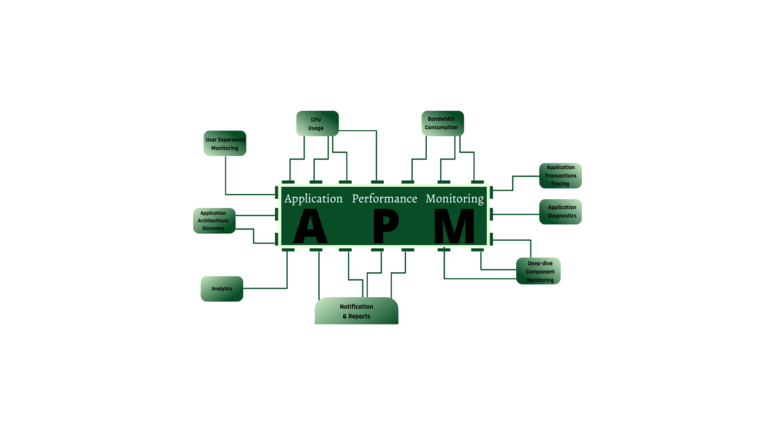
Deployment of an APM based on Kubernetes (Prt2)
The implementation phases of the APM app based on Kubernetes
This second part deals with the design and implementation phase of the solution based on Kubernetes and its details. We’ll see how the Deployment of an APM on Kubernetes works in another way we’ll look at how to instrument a Go program so that it emits OpenTelemetry-compliant traces, as well as how to transfer these traces to Elastic APM with kubernetes.
Presentation of the OpenTelemetry architecture
It’s necessary to understand the architecture of OpenTelemetry before diving into the intricacies of application instrumentation. Receivers, exporters, and collectors are the fundamental construction blocks.
There are other protocols to choose from, but the most prevalent is OTLP. Exporters function similarly to an API, encapsulating the specifics of how to deliver data to a certain backend. To create a processing pipeline, such as preparing data for sending to one or more destinations, collectors rely on a collection of receivers and exporters. The diagram below depicts this architecture.
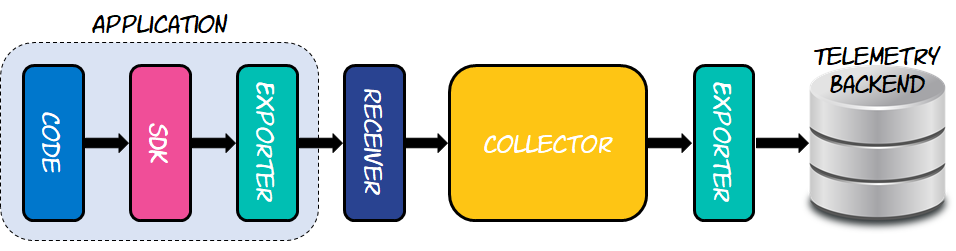
Because it has to be able to send the produced traces to the collector, the instrumented program, as indicated in the figure, comprises at least one of the construction elements, which are exporters. The collector resides between the instrumented application and the telemetry backend, which will be Elastic APM for the sake of this post. To accept the traces delivered by the instrumented application, the collector must employ a receiver. Similarly, because the collection has no idea how to send data to Elastic APM, it employs an exporter that does. This allows the collector to learn how the technology works.
The OpenTelemetry architecture, which focuses on receivers, exporters, and collectors, allows users to mix and match different protocols and technologies, giving them the freedom to pick multiple suppliers without losing compatibility. This implies you may create your program to output OpenTelemetry-compatible traces while in development, then switch to a different telemetry backend (ideally Elastic APM) once it’s ready for production.
Elastic stack configuration on kubernetes
Elastic APM uses Elasticsearch to store data and Kibana to visualize it.
elasticsearch.yaml
# elasticsearch.yaml
apiVersion: apps/v1
kind: Deployment
metadata:
  name: elasticsearch
spec:
   selector:
 matchLabels:
app: elasticsearch
replicas: 1
template:
metadata:
name: elasticsearch
labels:
app: elasticsearch
spec:
containers:
- name: elasticsearch
image: docker.elastic.co/elasticsearch/elasticsearch:7.13.2
env:
- name: "discovery.type"
value: "single-node"
ports:
- name: es-9200
containerPort: 9200
 imagePullPolicy: Always
---
apiVersion: v1
 kind: Service
metadata:
name: elasticsearch
labels:
app: elasticsearch s
pec:
type: NodePort
ports:
- name: es-9200
port: 9200
selector:
app: elasticsearch
---
Kibana.yaml
#Kibana.yaml
apiVersion: apps/v1
kind: Deployment
metadata:
name: kibana
spec:
selector:
matchLabels:
app: kibana
replicas: 1
template:
metadata:
name: kibana
labels:
app: kibana
spec:
containers:
- name: kibana
image: docker.elastic.co/kibana/kibana:7.13.2
env:
- name: "ELASTICSEARCH_URL"
value: "127.0.0.1:9200"
ports:
- name: kibana-5601
containerPort: 5601
imagePullPolicy: Never
---
apiVersion: v1
kind: Service
metadata:
name: kibana
labels:
app: kibana
spec:
type: NodePort
ports:
- name: kibana-5601
port: 5601
selector:
app: kibana
---
apm-server.yaml
#apm-server.yaml

apiVersion: apps/v1
kind: Deployment
metadata:
  name: apm-server
spec:
  selector:
   matchLabels:
    app: apm-server
  replicas: 1
  template:
   metadata:
    name: apm-server
    labels:
     app: apm-server
  spec:
   containers:
    - name: apm-server
      image: docker.elastic.co/apm/apm-server:7.13.2
    env:
    - name: "STORAGE_TYPE"
      value: "elasticsearch"
    - name: "ES_HOST"
      value: "127.0.0.1:9200"
    - name: "kibana_HOST"
      value: "127.0.0.1:5601"
   ports:
    - name: apm-server-8200
      containerPort: 8200
      imagePullPolicy: Never
---
apiVersion: v1
kind: Service
metadata:
  name: apm-server
  labels:
   app: apm-server
spec:
  type: NodePort
  ports:
  - name: apm-server-8200
    port: 8200
    selector:
app: apm-server
---
We deploy Elasticsearch, kibana and Elastic Apm in the default namespace of the same Kubernetes cluster.
kubectl apply -f./Elastickubectl port-forward service/elasticsearch 9200kubectl port-forward service/kibana 5601kubectl port-forward service/apm-server 8200Implementing a Collector
The collector is an important component of the design since it serves as the middleware that connects the instrumented application to the telemetry backend.
Use YAML to customize everything. As a result, construct a YAML file with the following content:
---
apiVersion: v1
kind: ConfigMap
metadata:
name: otel-collector-config
data:
config.yaml: |-
receivers:
otlp:
protocols:
grpc:
endpoint: 0.0.0.0:55680
http:
endpoint: 0.0.0.0:55681
hostmetrics:
collection_interval: 1m

scrapers:
cpu:
load:
memory:
processors:
batch: null
exporters:
elastic:
apm_server_url: 'http://apm-server:8200'
logging:
loglevel: DEBUG
extensions:
service:
pipelines:
metrics:
receivers:
- otlp
- hostmetrics
exporters:
- logging
- elastic
traces:
receivers:
- otlp
processors:
- batch
exporters:
- elastic
- logging
---
apiVersion: apps/v1
kind: Deployment
metadata:
name: otel-collector
labels:
app: opentelemetry
component: otel-collector
spec:
selector:
matchLabels:
app: opentelemetry
component: otel-collector
template:
metadata:
labels:
app: opentelemetry
component: otel-collector
spec:
containers:
- name: otel-collector
image: otel/opentelemetry-collector-contrib-dev:latest
imagePullPolicy: Never
resources:
limits:
cpu: 100m
memory: 200Mi
requests:
cpu: 100m
memory: 200Mi
volumeMounts:
- mountPath: /var/log
name: varlog
readOnly: true
- mountPath: /var/lib/docker/containers
name: varlibdockercontainers
readOnly: true
- mountPath: /etc/otel/config.yaml
name: data
subPath: config.yaml
readOnly: true
terminationGracePeriodSeconds: 30
volumes:
- name: varlog
hostPath:
path: /var/log
- name: varlibdockercontainers
hostPath:
path: /var/lib/docker/containers
- name: data
configMap:
name: otel-collector-config
---
apiVersion: v1
kind: Service
metadata:
name: otel-collector
labels:
app: opentelemetry
component: otel-collector
spec:
ports:
- name: metrics # Default endpoint for querying metrics.
port: 8888
- name: grpc # Default endpoint for OpenTelemetry receiver.
port: 55680
protocol: TCP
targetPort: 55680
- name: http # Default endpoint for OpenTelemetry receiver.
port: 55681
protocol: TCP
targetPort: 55681
selector:
component: otel-collector
configure A receiver for the OTLP protocol, and it expects to receive data through port 55680 from any network interface. The traces will be sent to this endpoint by the instrumented application. An extension is also configured to allow any downstream monitoring layer to do health checks on the collector. Health checks are performed by default through HTTP on port 13133. Finally, the collector sends the data to the endpoint http://apm-server:8200 using Elastic APM’s built-in exporter. For this to operate, Elastic APM should be available to this URL.
We deploy the collector in the same cluster kubernetes as before:
kubectl apply -f otel-config.yamlkubectl port-forward service/otel-collector 55680:55680 55681:55681 -n defaultApplication instrumentation
The objective of this project is to deploy an APM performance monitoring solution from any application. The following application is a Go microservice that sends traces and metrics to the collector using Opentelemetry.
# main.go
package main
import (
"context"
"encoding/json"
"log"
"net/http"
"os"
"runtime"
"time"
"github.com/gorilla/mux"
"go.opentelemetry.io/contrib/instrumentation/github.com/gorilla/mux/otelmux"
"go.opentelemetry.io/otel"
"go.opentelemetry.io/otel/attribute"
"go.opentelemetry.io/otel/exporters/otlp"
"go.opentelemetry.io/otel/exporters/otlp/otlpgrpc"
"go.opentelemetry.io/otel/metric"
"go.opentelemetry.io/otel/metric/global"
"go.opentelemetry.io/otel/propagation"
controller "go.opentelemetry.io/otel/sdk/metric/controller/basic"
processor "go.opentelemetry.io/otel/sdk/metric/processor/basic"
"go.opentelemetry.io/otel/sdk/metric/selector/simple"
"go.opentelemetry.io/otel/sdk/resource"
sdktrace "go.opentelemetry.io/otel/sdk/trace"
"go.opentelemetry.io/otel/semconv"
"go.opentelemetry.io/otel/trace"
)
const (
serviceName = "hello-app"
serviceVersion = "1.0"
metricPrefix = "custom.metric."
numberOfExecName = metricPrefix + "number.of.exec"
numberOfExecDesc = "Count the number of executions."
heapMemoryName = metricPrefix + "heap.memory"
heapMemoryDesc = "Reports heap memory utilization."
)
var (
tracer trace.Tracer
meter metric.Meter
numberOfExecutions metric.BoundInt64Counter
)
func main() {
ctx := context.Background()
// Create an gRPC-based OTLP exporter that
// will receive the created telemetry data
endpoint := os.Getenv("0.0.0.0:55680")
driver := otlpgrpc.NewDriver(
otlpgrpc.WithInsecure(),
otlpgrpc.WithEndpoint(endpoint),
)
exporter, err := otlp.NewExporter(ctx, driver)
if err != nil {
log.Fatalf("%s: %v", "failed to create exporter", err)
}
// Create a resource to decorate the app
// with common attributes from OTel spec
res0urce, err := resource.New(ctx,
resource.WithAttributes(
semconv.ServiceNameKey.String(serviceName),
semconv.ServiceVersionKey.String(serviceVersion),
),
)
if err != nil {
log.Fatalf("%s: %v", "failed to create resource", err)
}
// Create a tracer provider that processes
// spans using a batch-span-processor. This
// tracer provider will create a sample for
// every trace created, which is great for
// demos but horrible for production –– as
// volume of data generated will be intense
bsp := sdktrace.NewBatchSpanProcessor(exporter)
tracerProvider := sdktrace.NewTracerProvider(
sdktrace.WithSampler(sdktrace.AlwaysSample()),
sdktrace.WithResource(res0urce),
sdktrace.WithSpanProcessor(bsp),
)
// Creates a pusher for the metrics that runs
// in the background and push data every 5sec
pusher := controller.New(
processor.New(
simple.NewWithExactDistribution(),
exporter,
),
controller.WithResource(res0urce),
controller.WithExporter(exporter),
controller.WithCollectPeriod(5*time.Second),
)
err = pusher.Start(ctx)
if err != nil {
log.Fatalf("%s: %v", "failed to start the controller", err)
}
defer func() { _ = pusher.Stop(ctx) }()
// Register the tracer provider and propagator
// so libraries and frameworks used in the app
// can reuse it to generate traces and metrics
otel.SetTracerProvider(tracerProvider)
global.SetMeterProvider(pusher.MeterProvider())
otel.SetTextMapPropagator(
propagation.NewCompositeTextMapPropagator(
propagation.Baggage{},
propagation.TraceContext{},
),
)
// Instances to support custom traces/metrics
tracer = otel.Tracer("io.opentelemetry.traces.hello")
meter = global.Meter("io.opentelemetry.metrics.hello")
// Creating a custom metric that is updated
// manually each time the API is executed
numberOfExecutions = metric.Must(meter).
NewInt64Counter(
numberOfExecName,
metric.WithDescription(numberOfExecDesc),
).Bind(
[]attribute.KeyValue{
attribute.String(
numberOfExecName,
numberOfExecDesc)}...)
// Creating a custom metric that is updated
// automatically using an int64 observer
_ = metric.Must(meter).
NewInt64ValueObserver(
heapMemoryName,
func(_ context.Context, result metric.Int64ObserverResult) {
var mem runtime.MemStats
runtime.ReadMemStats(&mem)
result.Observe(int64(mem.HeapAlloc),
attribute.String(heapMemoryName,
heapMemoryDesc))
},
metric.WithDescription(heapMemoryDesc))
// Register the API handler and starts the app
router := mux.NewRouter()
router.Use(otelmux.Middleware(serviceName))
router.HandleFunc("/hello", hello)
http.ListenAndServe(":8888", router)
}
func hello(writer http.ResponseWriter, request *http.Request) {
ctx := request.Context()
ctx, buildResp := tracer.Start(ctx, "buildResponse")
response := buildResponse(writer)
buildResp.End()
// Creating a custom span just for fun...
_, mySpan := tracer.Start(ctx, "mySpan")
if response.isValid() {
log.Print("The response is valid")
}
mySpan.End()
// Updating the number of executions metric...
numberOfExecutions.Add(ctx, 1)
}
func buildResponse(writer http.ResponseWriter) Response {
writer.WriteHeader(http.StatusOK)
writer.Header().Add("Content-Type",
"application/json")
response := Response{"Hello"}
bytes, _ := json.Marshal(response)
writer.Write(bytes)
return response
}
// Response struct
type Response struct {
Message string `json:"Message"`
}
func (r Response) isValid() bool {
return true
}
The application can issue spans which are HTTP requests in this case. Then, we create a Docker image of this application from this Dockerfile
# Dockerfile
FROM golang:latest
WORKDIR /app
COPY . .
RUN go build -o main .
EXPOSE 8888
# Command to run the executable
CMD ["./main"]
docker build -t hello-app:latestWe then deploy this application in our cluster.
aapiVersion: apps/v1
kind: Deployment
metadata:
name: hello-app
spec:
replicas: 1
selector:
matchLabels:
app: hello-app
template:
metadata:
name: hello-app
labels:
app: hello-app
spec:
containers:
- name: hello-app
image: hello-app:latest
env:
- name: EXPORTER_ENDPOINT
value: "0.0.0.0:55680"
imagePullPolicy: Never
ports:
- name: hello-app

containerPort: 8888

---
apiVersion: v1
kind: Service
metadata:
name: hello-app
labels:
app: hello-app
spec:
type: Load Balancer
ports:
- name: hello-app
port: 8888
selector:
app: hello-app
-
---
apiVersion: extensions/v1beta1
kind: Ingress
metadata:
name: hello-app-ingress
spec:
rules:
- http:
paths:
- path: /hello
backend:
serviceName: hello-app
servicePort: 8888
kubectl apply -f app.yamlTo check the status of the Ingress resource you set up in the previous step, use the following command:
kubectl get ingRun the following command to enable the NGINX Ingress controller:
minikube addons enable ingress The virtual machine of Minikube is accessible to the host system via an IP address that is only routable from the host and may be got using the minikube ip command.
minikube ip List all resources in a namespace with kubectl get all
kubectl get all 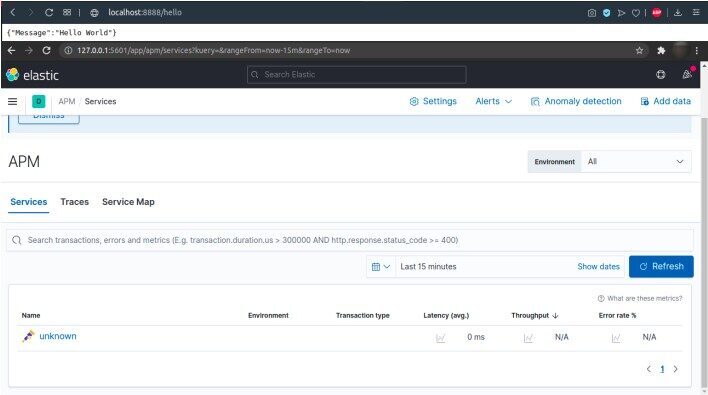
Canary deployment implementation
For teams that have established a continuous delivery approach, Canarian deployments are a solid practice. A new feature is first made available to a select group of users via a canary deployment. Depending on the volume of traffic, the new feature is observed for few minutes to many hours, or just long enough to acquire significant data. If the team discovers a flaw, the new feature is swiftly disabled. If no issues are discovered, the feature is made available to all users.
A canary deployment converts a portion of your users into your own early warning system, ideally one that is bug-tolerant. Before distribute your program, this user group finds defects, faulty features, and unintuitive features.
We begin by building our application’s two image variants.
Kubernetes deployment with canaries
docker build -t hello-app:1.0docker build -t hello-app:2.0We will then deploy version 2.0 of our application
apiVersion: apps/v1
kind: Deployment
metadata:
name: hello-app-v1
spec:
replicas: 1
selector:
matchLabels:
app: hello-app

template:
metadata:
name: hello-app
labels:
app: hello-app
spec:
containers:
- name: hello-app-v1
image: hello-app:1.0
env:
- name: EXPORTER_ENDPOINT
value: "0.0.0.0:55680"
imagePullPolicy: Never
ports:
- containerPort: 8888

---
apiVersion: apps/v1
kind: Deployment
metadata:
name: hello-app-v2
spec:
replicas: 1
selector:
matchLabels:
app: hello-app
template:
metadata:
name: hello-app
labels:
app: hello-app
spec:
containers:
- name: hello-app-v2
image: hello-app:2.0
env:
- name: EXPORTER_ENDPOINT
value: "0.0.0.0:55680"
imagePullPolicy: Never
ports:
- containerPort: 8888

---
apiVersion: v1
kind: Service
metadata:
name: hello-app
labels:
app: hello-app
spec:
ports:
- name: hello-app
port: 8888
selector:
app: hello-app
---
kubectl apply -f canary-deployment.yamlTo regulate traffic distribution, we’d need to alter the number of replicas in each deployment.
However, because deploy the service in an istio compliant cluster, we will simply need to construct a routing rule to govern traffic distribution.
As an example, consider the following routing rule:
apiVersion: networking.istio.io/v1alpha3
kind: VirtualService
metadata:
name: hello-app
spec:
hosts:
- hello-app
http:
- route:
- destination:
host: hello-app-v1
weight: 90
- destination:
host: hello-app-v2
weight: 10
---
apiVersion: networking.istio.io/v1alpha3
kind: DestinationRule
metadata:
name: hello-app
spec:
host: hello-app
This article provided a quick overview of OpenTelemetry and why it is important to today’s cloud-native applications. You’ve learned how to use Go Apps tools as well as their architecture, as well as the deployment of an APM. We’ve previously implemented canary deployment to reduce errors by automatically ensuring that the app is running before it’s release to production. We highly recommend that you explore OpenTelemetry further in conjunction with Elastic APM, which provides excellent support for other pillars of the system’s true observability, such as logs and metrics.
If you haven’t seen the 1st part of the article, click on the following title: Deployment of an APM based on Kubernetes (Part1)