- +212 5 21 10 22 14 | +212 5 22 21 97 82
- +33 7 57 80 30 21
- [email protected]




BUDGETING AND COST TRACKING BY ZEN
Budgeting and Cost Tracking by Zen is a Jira application that integrates financial control directly into your Jira workspace.
Discover MoreTable of Contents
1. Application Overview
Budgeting and Cost Tracking by Zen is a Jira application that integrates financial control directly into your Jira workspace. Create budgets linked to your projects, epics, or issues and track them in real time.
Budgets can be defined as a monetary amount (with currency) or as working days. Each budget supports a detailed cost breakdown by team member, with hourly rates automatically applied to calculate the total consumed cost.
2. Key Features
- Budget Creation: Create budgets by amount or by days, linked to projects, epics, or issues, with periods and client tracking.
- Real-Time Hours: Automatically retrieves Jira work logs. Consumed hours and remaining capacity are updated live.
- JQL Filtering: Use any JQL query to define the scope of a cost line, with field auto-completion.
- Cost Breakdown: Cost lines per user with hourly rates. Period filtering (This Month, Last Month, 3 Months, or Custom).
- Team Sharing: Share budgets with selected members or the entire team for collaborative visibility.
- Status Workflow: Budgets follow a Draft → Submitted → Approved / Rejected workflow for manager validation.
- CSV Export: Export the full budget list with all columns for reporting, auditing, or external analysis.
- Budget Filters: Filter the list by name, client, project, epic, and date range. Results update instantly.
- Dashboard: Overview with global KPIs, distribution charts, and EVM (Earned Value Management) tracking per budget.
- Financial (CAPEX/OPEX): Profitability tracking with capital and operational expense inputs, revenue, and billing rates.
- Invoicing: Create and manage professional invoices with live preview and native PDF export.
3. Use Cases
- Track a client project budget against hours actually logged by the team.
- Monitor sprint costs by linking a budget to specific epics or issues.
- Use JQL to filter by assignee and track individual contributor costs.
- Compare budgeted days to consumed hours across multiple projects.
- Submit budgets for manager approval before project kick-off.
- Share budget visibility with finance teams.
- For external reporting or billing, export budget data to CSV.
- Create and send professional invoices directly from the tool, linked to existing budgets.
4. Getting Started
Once the application is installed on your Jira site, access it from the global Jira navigation bar under Budgeting and Cost Tracking by Zen.
- Step 1: Click on Budgeting and Cost Tracking by Zen in the Jira navigation bar.
- Step 2: The main Budgets page loads. The creation form is at the top; the budget list is below.
- Step 3: Fill in the form and click Create a Budget to create your first budget.
- Step 4: Click View on a budget to open its detail page and add cost lines.
- Step 5: Monitor progress, consumed and remaining amounts and hours are updated automatically from Jira work logs.
5. Creating a Budget
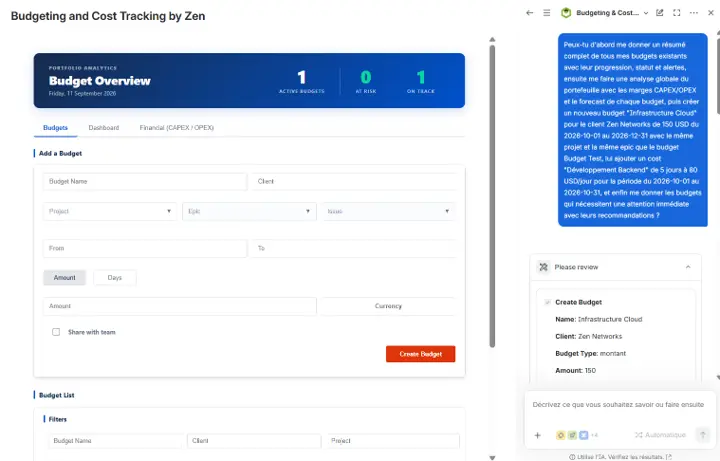
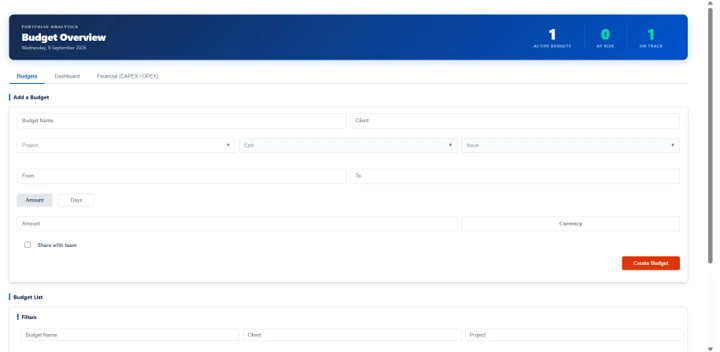
The budget creation form is always visible at the top of the main page. Fill in the fields and click Create a Budget.
Budget Type: Choose Amount to budget in money (with currency), or Days to budget in working days. This choice affects how consumed/remaining values are displayed throughout the application.
Budget Fields
6. Managing Budgets
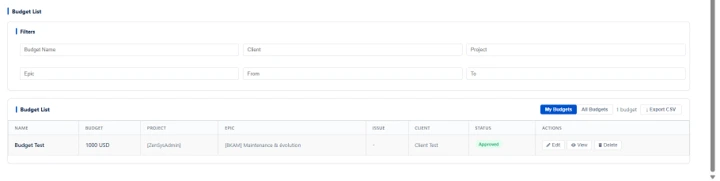
The budget list displays all budgets you own or that have been shared with you.
My Budgets / All Budgets
Use the toggle button at the top right of the list to switch between My Budgets (budgets you created) and All Budgets (all budgets visible to you).
Filters
Six filtering fields let you narrow the list: Budget Name, Client, Project, Epic, Start Date, End Date. Filters apply instantly as you type.
Budget Actions
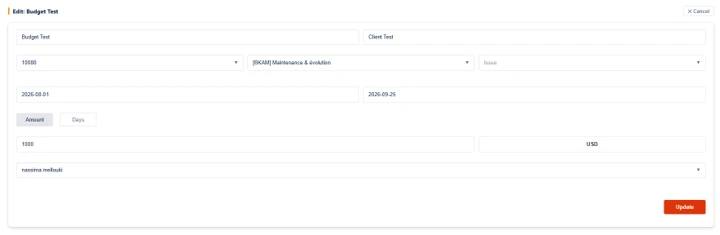
- Edit: Modify the name, scope, dates, or amount of the budget. The form scrolls into view with pre-filled values.
- View: Opens the budget detail page to see the progress summary, cost breakdown, and add cost lines.
- Delete: Permanently deletes the budget and all its cost lines. This action is irreversible, a confirmation prompt is shown.
- Submit: Available on Draft and Rejected budgets. Sends the budget for manager validation.
CSV Export
Click Export CSV in the budget list to download all visible (filtered) budgets as a spreadsheet with columns: Name, Budget, Project, Epic, Issue, Client, Status.

7. Budget Detail Page
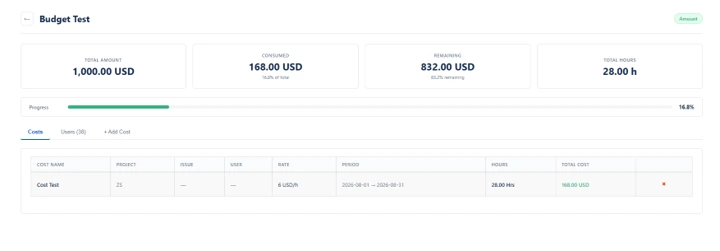
Click View on any budget to open its detail page. The page has three tabs: Costs, Users, and + Add a Cost.
Summary Tiles
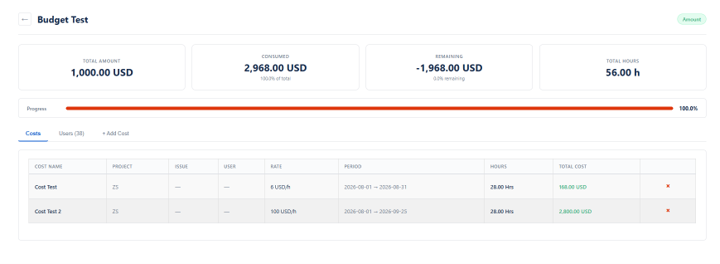
- Total Amount: The budget cap as defined at creation (in currency or days).
- Consumed: The total amount already used, calculated using the hourly rate for each cost line and the hours recorded in Jira.
- Remaining: Total amount minus consumed. Displays the remaining available budget.
- Total Hours: Total hours logged in Jira across all cost lines, retrieved in real time.
A progress bar below the tiles visually shows the percentage consumed. The bar turns red when the budget is exceeded (beyond 100%).
Costs Tab
Lists all cost lines with: Cost Name, Project, Issue, User, Rate (per hour), Period, Hours (from Jira), and Total Cost.
Users Tab
Displays all Jira users who have logged time within the scope of this budget.
Use Cases
- Time Tracking for Teams:
- For effective project analysis, arrange worklogs into customisable groups that don’t change in Jira groups.
- Advanced Reporting:
- Generate detailed timesheets with multi-level breakdowns.
- Streamlined Invoicing:
- Determine invoice totals automatically using tax regulations and Jira worklogs.
8. Adding a Cost Line
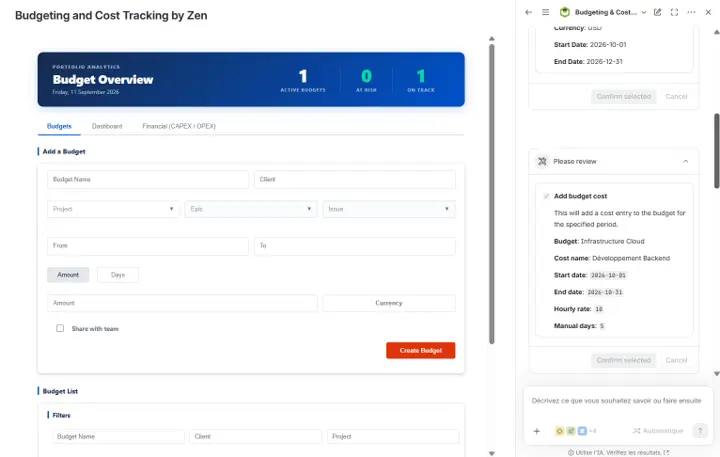
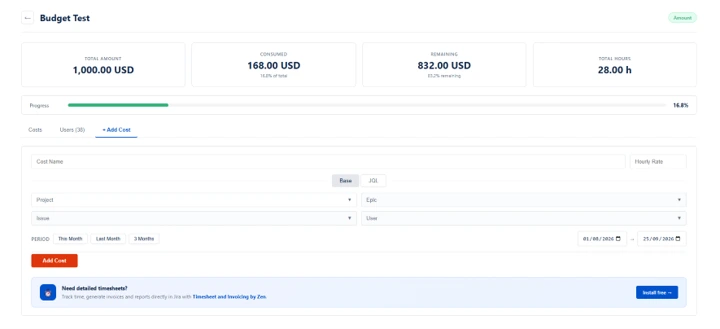
Inside a budget, click the + Add a Cost tab to add a cost line. Each cost line tracks hours from Jira work logs within a defined scope and calculates the cost by applying the hourly rate.
9. JQL Mode
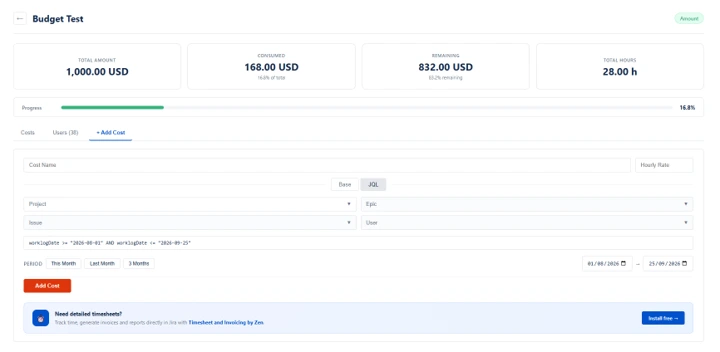
Switch to JQL mode in the add cost form to define the issue scope using any JQL (Jira Query Language) expression. The application passes your query directly to Jira and accounts for work logs on all returned issues.
The table columns (Project, Issue, User) are automatically extracted from your JQL expression and displayed in the cost list.
10. Status Workflow
Budgets follow a four-step approval workflow. The available action buttons on each budget change based on its current status.
- Draft: Initial state when a budget is created. Visible only to the creator. Can be freely edited. Actions: Edit, Delete, Submit.
- Submitted: The budget has been sent for validation. Cannot be modified during review. Available actions for the manager: Approve or Reject.
- Approved: The budget is active and tracking costs. Hours are retrieved from Jira in real time. Action: View.
- Rejected: The budget was not approved. Can be revised and submitted again. Actions: Edit, Delete, Submit.

11. Field Reference
The table below lists all budget fields with their description and whether they are required.
Field | Description | Required |
Budget Name | Unique identifier for the budget. | Yes |
Budget Type | Amount (monetary) or Days (working days). | Yes |
Currency | Currency used when type is Amount. | Yes (Amount) |
Total Amount / Days | Budget cap value. | Yes |
Project | Jira project linked to the budget. | No |
Epic | Jira epic linked to the budget. | No |
Issue | Specific Jira issue linked to the budget. | No |
Client | Client name for reporting purposes. | No |
Start Date | Budget period start date. | No |
End Date | Budget period end date. | No |
Shared With | Team members who can view the budget. | No |
12. Dashboard Tab
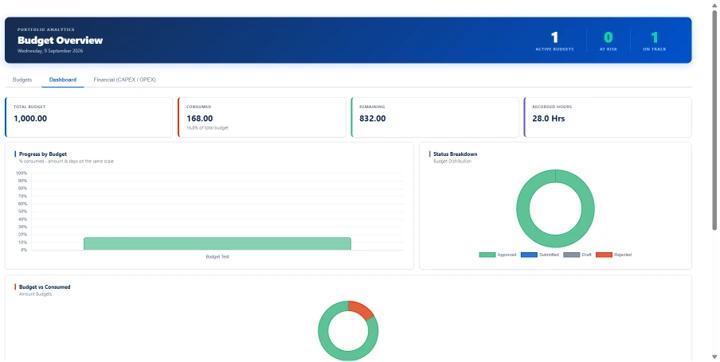
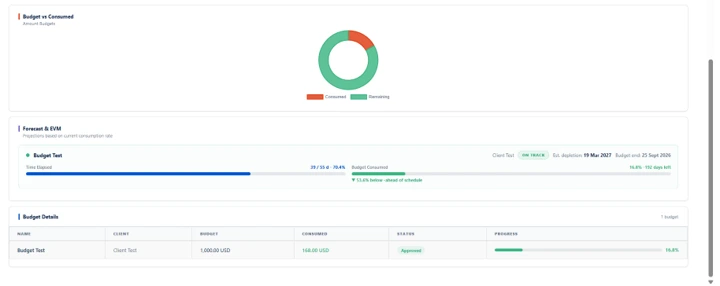
The Dashboard tab provides a visual summary of all active budgets. It centralises key performance indicators (KPIs), distribution charts, and real-time EVM (Earned Value Management) tracking.
Global KPI Banner
At the top of the Dashboard, three tiles display global metrics across all budgets:
- Active Budgets: Total number of budgets currently being tracked.
- At Risk: Budgets where consumption exceeds 80% of the cap (critical alert threshold).
- On Track: Budgets where consumption remains below 80% of the cap.
The banner also displays the current date and the number of days remaining in the current budget period.
Distribution Charts
Two doughnut charts provide visual representations of:
- Budget distribution by status, Approved, Submitted, Draft, Rejected.
- Overall consumption, Consumed vs Remaining for Amount-type budgets, or Days Consumed vs Days Remaining for Days-type budgets.
Summary Table
The detail table lists all budgets with the following columns:
- Name: Budget name.
- Client: Client associated with the budget.
- Budget: Total value defined (monetary amount or number of days).
- Consumed: Amount or days consumed to date.
- Status: Current workflow status (Approved, Submitted, Draft, Rejected).
- Progress: Visual progress bar with consumption percentage.
EVM Tracking (Earned Value Management) per Budget
Each budget has an EVM card with the following indicators:
- Overall Status: ON TRACK (consumption within expected limits), WATCH (between 70% and 90% of cap), AT RISK (beyond 90%).
- Depletion: Estimated date the budget will be exhausted at the current consumption rate.
- Budget End: End date defined at budget creation.
- Time Elapsed: Percentage of the budget period already elapsed.
- Days Left: Number of days remaining before the end of the period.
- Pace Indicator: above planned pace (consuming faster than planned) or below, ahead of schedule (consumption ahead of schedule).
Automatic Alert Badges
Colour-coded badges appear automatically on critical budgets:
- EXCEEDED (red): Budget overrun, consumption exceeds 100% of the cap.
- CRITICAL (orange): Consumption between 90% and 100% of the cap.
- Depletion: <date> (yellow): Estimated depletion date displayed directly on the budget card.

13. Financial Tab (CAPEX / OPEX)
The Financial tab allows you to enter and visualise financial data for each budget, capital expenditures (CAPEX), operational expenditures (OPEX), revenue, and billing rates, for complete profitability tracking.
Global KPI Tiles
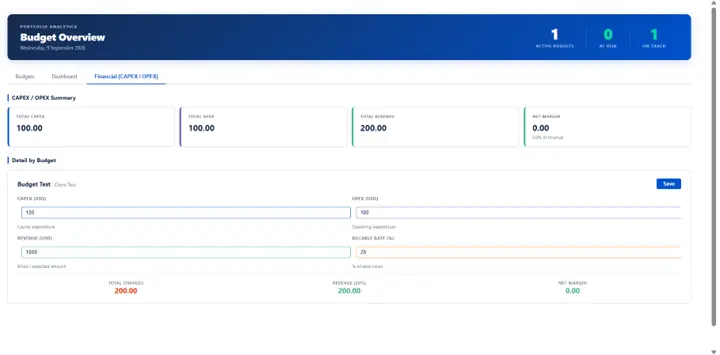
At the top of the tab, four tiles aggregate financial data across all budgets:
- Total CAPEX: Sum of all capital expenditures across all budgets.
- Total OPEX: Sum of all operational expenditures across all budgets.
- Total Revenue: Sum of effective revenue from all budgets, after applying each budget’s Billable Rate (Revenue × Billable Rate%).
- Net Margin: Overall net margin: Total Effective Revenue, Total CAPEX, Total OPEX. Also displays the percentage relative to total revenue.
CAPEX / OPEX Summary Section
A global summary of charges split between CAPEX and OPEX is displayed as coloured tiles, allowing you to quickly distinguish capital investments from operational costs across the entire portfolio.
Detail by Budget Section
Each budget appears as a card with four editable fields:
- CAPEX (currency): Capital expenditure amount (infrastructure, licences, equipment). Blue accent.
- OPEX (currency): Operational expenditure amount (salaries, services, maintenance). Purple accent.
- Revenue (currency): Gross amount billed or expected from the client for this budget. Green accent.
- Billable Rate (%): Percentage of billable hours relative to total logged hours. Orange accent. This rate is applied directly to Revenue to calculate effective revenue (e.g. Revenue 1,000 × 20% = 200 effective).
Calculated Financial Summary
Each budget card automatically displays real-time calculated indicators:
- Total Charges: Sum of CAPEX and OPEX for this budget.
- Revenue (X%): Effective revenue after applying the Billable Rate. The percentage is shown in the label to indicate the rate used.
- Net Margin: Effective revenue minus Total Charges. Positive = profit (green), negative = deficit (red).
Entry and Saving
Financial fields are filled in directly on each budget card. A Save button confirms the entry. The indicator changes to ✓ Saved after confirmation, then reverts to Save on the next modification. If no Billable Rate is entered, it defaults to 100%.
14. AI-Powered Assistant (Rovo Agent)
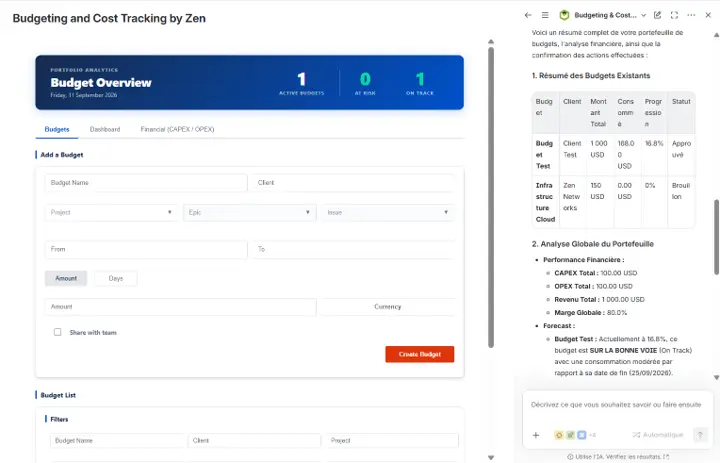
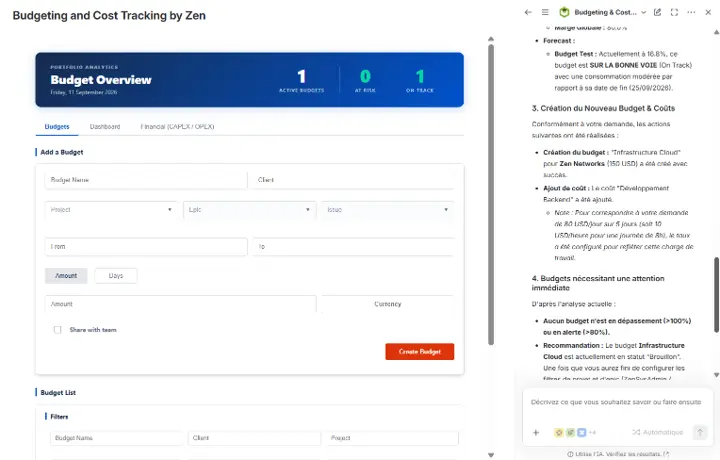
Budgeting & Cost Tracking by Zen integrates a native Rovo AI agent directly into your Atlassian workspace. Without leaving Jira, you can ask questions in natural language and get instant answers about your budgets, costs, and financial performance. The agent can list all your budgets with progress and status, detect overages, analyze CAPEX/OPEX margins, forecast burn rates and depletion dates, and generate full portfolio health reports. It also takes action on your behalf, creating budgets, adding cost entries, changing approval statuses, and even creating Jira epics and issues, all through a simple conversation. No configuration required: the agent is available automatically after installation for any user with a Rovo subscription.